

Reverse Proxy Access Logs
Updated
NetBird logs every request and connection that passes through your reverse proxy services, including both HTTP and L4 (TCP, UDP, TLS) traffic. Access logs provide visibility into who is accessing your services, from where, and whether requests were allowed or denied. This is useful for auditing, debugging, and monitoring traffic to your publicly exposed services.
Viewing access logs
Access logs are available in the NetBird dashboard under Reverse Proxy > Access Logs. This view displays a table of all HTTP requests and L4 connections that have passed through your reverse proxy services, with filters to narrow down results by time range, status, or other fields.
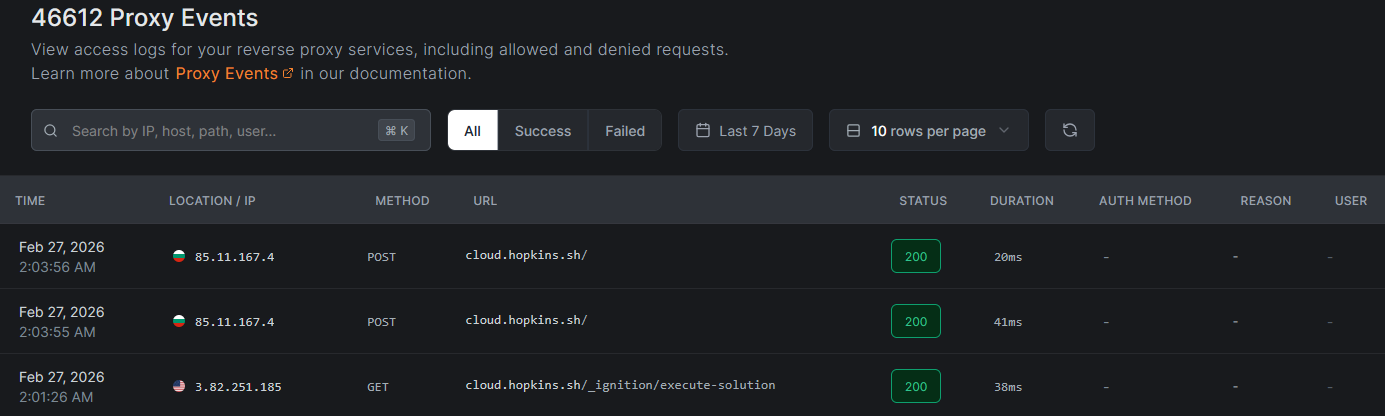
You can also retrieve access logs programmatically using the API:
GET /api/events/proxy
What access logs capture
Every log entry (HTTP and L4) shares a common set of fields. Some fields are only meaningful for certain protocols.
| Field | Description | HTTP | L4 (TCP/UDP/TLS) |
|---|---|---|---|
| Timestamp | When the request or connection occurred | Yes | Yes |
| Protocol | http, tcp, udp, or tls | Yes | Yes |
| Method | HTTP method (GET, POST, etc.). For L4, displays the protocol name. | Yes | Protocol name |
| Host / URL | Domain and path for HTTP. Host and listen port for L4. | host/path | host:port |
| Status Code | HTTP status code (200, 401, 403, 500, etc.) | Yes | Empty |
| Duration | Request or connection duration in milliseconds | Yes | Yes |
| Bytes Uploaded | Bytes sent from client to backend | Yes | Yes |
| Bytes Downloaded | Bytes sent from backend to client | Yes | Yes |
| Source IP | The client's IP address | Yes | Yes |
| Location | Country, city, and subdivision based on source IP geolocation | Yes | Yes |
| Auth Method | Raw auth_method_used value: oidc (shown as SSO in the dashboard), password, pin, or header. For denied requests, carries the restriction code instead (e.g. ip_restricted, crowdsec_ban). Omitted from the API response when empty | Yes | Restriction code on denials |
| User | The authenticated user's ID, set when oidc authentication was used. Omitted from the API response when empty | Yes | N/A |
| Reason | Exactly one of two values: Authentication failed when authentication or an access restriction rejected the request, or Request failed when an authenticated request returned 4xx/5xx. Set for HTTP entries only and omitted from the API response when empty. Never a specific denial code: see the note under Deny reasons | Yes | Omitted |
Understanding log entries
HTTP log entries
HTTP log entries fall into three categories based on the status code:
- Allowed requests: successful requests show a
2xxstatus code along with the authentication method used to access the service. - Denied requests: failed authentication or access restriction blocks show
401or403status codes withreasonset toAuthentication failed. The specific cause (invalid password, missing SSO session, IP restricted, country restricted, CrowdSec verdict) is carried inauth_method_used, not inreason. - Errors: backend errors or proxy issues show
5xxstatus codes. These typically indicate that the target service is unreachable or returned an error.
L4 log entries
L4 entries are logged when the connection closes and record the total bytes transferred in each direction and the connection duration. L4 entries do not have HTTP status codes.
Denied L4 connections (blocked by access restrictions) are logged immediately. L4 entries carry no reason value, so the restriction code identifies the denial. Since L4 services do not support authentication, denials come from access restrictions only.
Deny reasons
The following deny reasons identify why a connection was rejected. Note that for HTTP services these values are not carried in the entry's reason field: see the note below the table.
| Reason | Description |
|---|---|
ip_restricted | The client IP was blocked by a CIDR access restriction |
country_restricted | The client's country was blocked by a country access restriction |
geo_unavailable | Country restrictions are configured but the GeoIP database is unavailable (fail-closed) |
crowdsec_ban | The client IP has a CrowdSec ban decision |
crowdsec_captcha | The client IP has a CrowdSec captcha decision |
crowdsec_throttle | The client IP has a CrowdSec throttle decision |
crowdsec_unavailable | CrowdSec enforce mode is active but the bouncer has not completed its initial sync (fail-closed) |
All CrowdSec decision types (ban, captcha, throttle) result in a connection denial in enforce mode. The proxy does not serve captcha challenges or apply rate limiting: the decision type is recorded for informational purposes only.
For HTTP services, the deny code from the table above is recorded in the auth_method_used field, and the entry's reason field carries a synthesized generic value rather than the specific code. This applies to every access restriction, not only CrowdSec:
{ "status_code": 403, "reason": "Authentication failed", "auth_method_used": "ip_restricted" }
{
  "status_code": 403,
  "reason": "Authentication failed",
  "auth_method_used": "crowdsec_ban",
  "metadata": { "crowdsec_verdict": "crowdsec_ban" }
}
When reading entries through GET /api/events/proxy, match on auth_method_used (and metadata.crowdsec_verdict for CrowdSec specifically) rather than reason.
Observe-mode entries carry the normal status code and record both crowdsec_mode and crowdsec_verdict in metadata. Because the connection is allowed, CrowdSec itself contributes no reason, but the field can still be populated by a later stage of the request such as an authentication or backend failure. Treat metadata.crowdsec_mode as the signal that an entry is an observe-mode verdict, not the absence of reason.
When CrowdSec is in observe mode, the verdict appears in the log metadata and CrowdSec adds no deny reason of its own (the connection is allowed). In the dashboard, these entries render with an observe-mode badge on the reason cell and show the underlying decision type (ban, captcha, throttle, unavailable) on hover. This lets you audit what CrowdSec would block without affecting traffic. For a self-test workflow, see Testing the integration.
Use cases
Access logs support several operational and security workflows:
- Security auditing - Review who accessed sensitive services, which authentication method they used, and from which geographic locations. This helps identify unauthorized access attempts and verify that authentication policies are working as expected.
- Debugging - Trace failed requests to understand authentication or routing issues. The status code, duration, and reason fields help pinpoint whether problems originate from authentication configuration, target availability, or network connectivity.
- Monitoring - Track usage patterns across your services. Identify which services receive the most traffic, peak usage times, and unusual access patterns that may warrant investigation.
- Compliance - Maintain records of service access for regulatory requirements. Access logs provide an auditable trail of who accessed what, when, and from where.
Retention and Cleanup
For the cloud version of NetBird, access logs are retained for 7 days.
For the self-hosted version, access log retention can be configured in the management.json or config.yaml by setting the following config parameters:
{
    "ReverseProxy": {
        "AccessLogRetentionDays": 7,
        "AccessLogCleanupIntervalHours": 24
    }
}
reverseProxy:
  accessLogRetentionDays: 7
  accessLogCleanupIntervalHours: 24
- accessLogRetentionDays - Define how long access logs are retained before they are automatically deleted.
- accessLogCleanupIntervalHours - Set how often the system checks for and deletes expired access log entries.
Related pages
- Reverse Proxy Overview - learn how to create and manage reverse proxy services
- Audit Events Logging - view management-level events such as configuration changes and user activity
- Traffic Events Logging - monitor network-level traffic events across your NetBird mesh